Amplifier Frequency Response
As the frequency of the input increases, the corresponding changes in the impedances of the capacitors and inductors can change the behavior of our amplifiers. The inherent parasitic capacitances and inductances in our transistors, resistors, wires, etc., determine the inherent frequency response of our amplifiers. We can, however, add our own capacitors and/or inductors to modify these frequency-dependent behaviors, to achieve certain specifications.
The Common-Emitter Amplifier
Let us start the common-emitter amplifier shown below. This amplifier is the same amplifier in Figure 4 of tutorial 5, and is biased the same way.
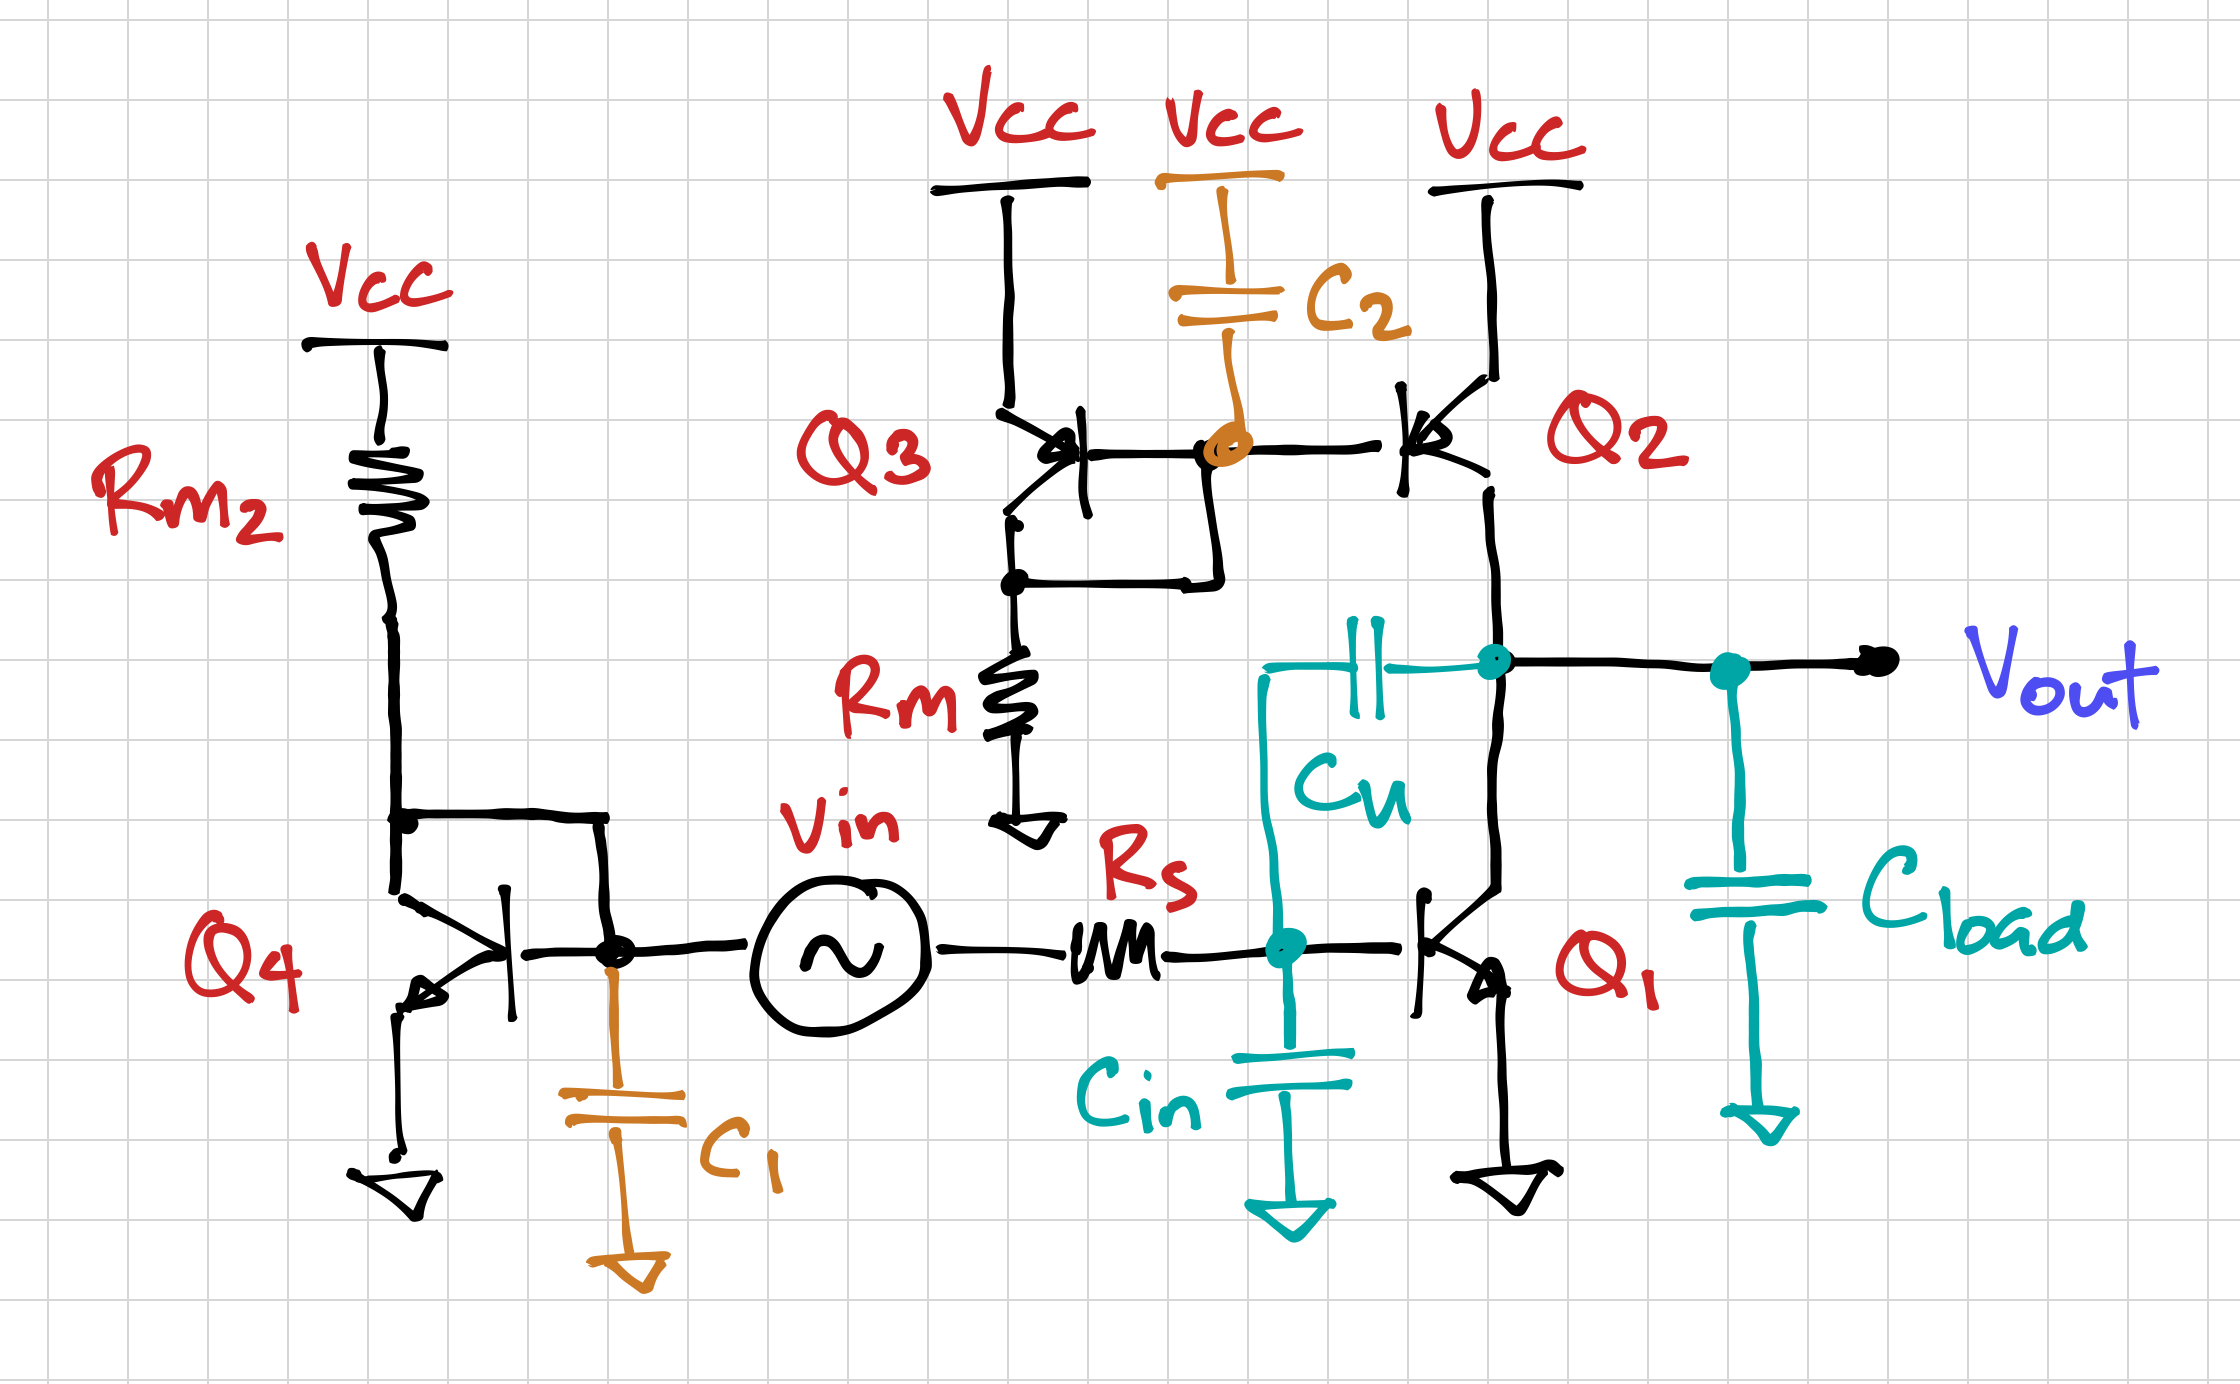
Note that the capacitors in Figure 1 can be the inherent parasitic capacitors of the transistors, or discrete capacitors that are added to change the frequency response of the amplifier. For example, we can set the relative frequency locations of the poles, e.g. which pole is dominant (the lowest frequency pole), or which poles we want to be at higher frequencies relative to the zero, etc.
Capacitors C1 and C2 are bias capacitors, meant to make sure the DC voltage generators (e.g. the diode connected transistors Q3 and Q4, which generate the base-emitter voltages for Q1 and Q2) always look like small-signal ground. We can then derive the small-signal equivalent circuit of the common-emitter amplifier, as shown in Figure 2.

Using nodal analysis, we can then solve for the gain as a function of frequency, assuming ![]() ,
, ![]() , and
, and ![]() :
:
![]()
Thus, as expected, we get the DC gain:
![]()
And with the following left-half plane poles and the right-half plane zero:
![]()
![]()
![]()
Let’s use ![]() ,
, ![]() ,
, ![]() , and
, and ![]() . Note also that we have added a source resistance,
. Note also that we have added a source resistance, ![]() , to simulate a real small-signal source. We can then calculate the DC gain, as well as the pole and zero frequencies:
, to simulate a real small-signal source. We can then calculate the DC gain, as well as the pole and zero frequencies:
![]()
![]()
![]()
![]()
Note that after the first pole, the gain should drop by 20dB per decade. With again of around 40 dB, we expect the unity gain frequency to be 2 decades above the first pole, which is significantly less than the frequency of the second pole. Thus, we can calculate the unity gain frequency as:
![]()
We can run an AC analysis, and examine its magnitude and phase response using this SPICE netlist and Python script, and plotting the results, we get:
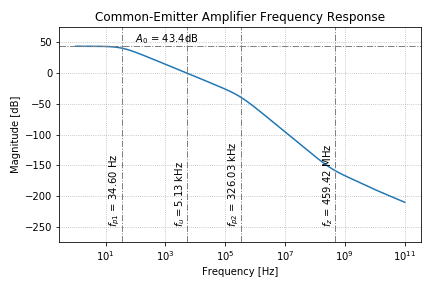
Using our Python script to fit the simulated magnitude response to that of a 2-pole, 1-zero transfer function, we can get the low frequency (DC) gain, and the locations of the two poles and the zero. We can also find the amplifier unity gain frequency, ![]() . Note that the values from our hand calculations are in agreement with the our simulation results.
. Note that the values from our hand calculations are in agreement with the our simulation results.
We can also take the derivative of the magnitude response in Figure 3, and determine the slopes of the regions between the poles and zeros:
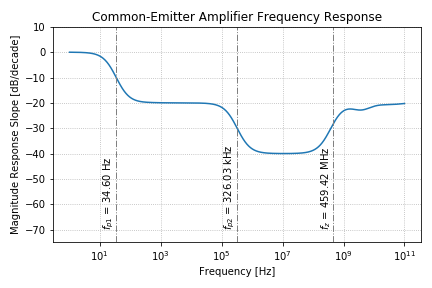
As expected, after the first pole, we get -20 dB per decade of roll-off, and after the second pole, we get -40 dB per decade. The zero then brings back the slope to -20 dB per decade. Notice that at very high frequencies, it seems that the slopes change erratically. This is because of the closely-spaced high frequency poles and zeros due to the parasitic capacitances of the transistors
The phase response of the common-emitter amplifier is plotted below.
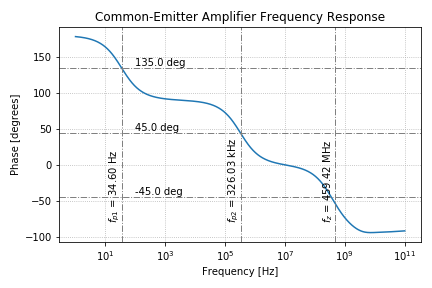
As expected, we get an initial phase of ![]() at low frequencies since the common-emitter amplifier is an inverting amplifier. We then get a
at low frequencies since the common-emitter amplifier is an inverting amplifier. We then get a ![]() phase shift for every pole and zero, since the zero is in the right-half plane. Also, note the phase drops by
phase shift for every pole and zero, since the zero is in the right-half plane. Also, note the phase drops by ![]() at the pole and zero frequencies.
at the pole and zero frequencies.
Notice that our SPICE netlist also simulates the frequency response as we vary the capacitor values. You can verify that the changes in the pole and zero frequencies are consistent with our analysis above.
Transient Response
We can verify the results of our AC analysis by looking at the transient response of our amplifier to input sinusoids at different frequencies. If we set the input frequency to 1Hz, we get the following transient response:
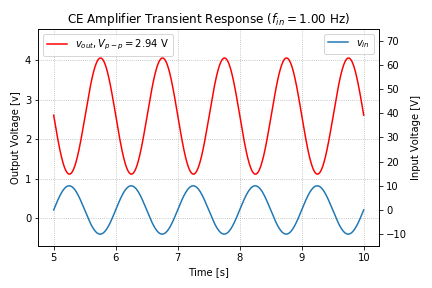
We get a gain of 147, or 43.34 dB, with ![]() of phase shift, i.e. the peaks are half a period apart. If we increase the input frequency to 1kHz, we get the following transient response:
of phase shift, i.e. the peaks are half a period apart. If we increase the input frequency to 1kHz, we get the following transient response:
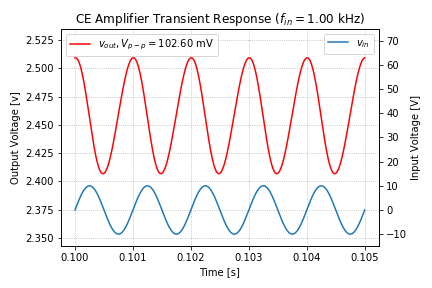
At an input frequency of 1kHz, we get a gain of 5.13 or 14.2 dB. Note that the peaks of the output are ahead of the input peaks by roughly 1/4 of the period, for a phase shift of approximately ![]() , as expected from the phase plot in Figure 5.
, as expected from the phase plot in Figure 5.
If we set the input frequency to the unity gain frequency, ![]() , we get the transient response below:
, we get the transient response below:
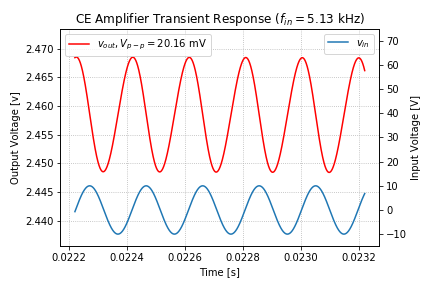
As expected, the gain drops to 1 or equivalently, to 0 dB, and the phase of the output relative to the input is still approximately ![]() .
.
Note that our transient analysis statements in the SPICE netlist takes on an extra parameter: tran <step_time> <stop_time> <start_time>. This is useful for cases where it takes a long time for the output to settle to its steady state response, either due to very small signals, or very large capacitances and/or inductances. The transient response starts from time zero, but the values are only saved starting at <start_time>.
End of Tutorial 10
Congratulations! You have just simulated the AC response of a common-emitter amplifier, and verified this response using a transient analysis.
